
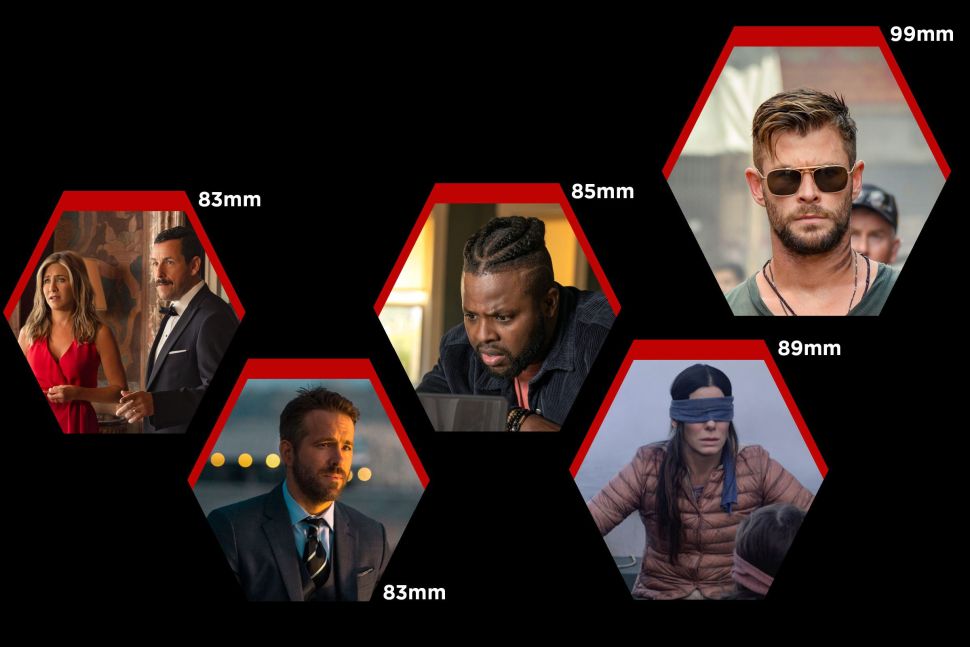
The viewership for Netflix’s top films, in the millions. Photo-illustration: Eric Vilas-Boas/Observer via Netflix
I’ve begun comparing the streaming industry to Leave It to Beaver‘s resident sycophant Eddie Haskell. In both cases, it’s nigh impossible to elicit a straight answer on anything.
Recently, I dove deep to explore why streaming services feel the need to guard their viewership data like a government hiding its black ops efforts. Back in April, I also attempted to paint a picture of Netflix’s most popular original TV series for Q1 2021. And in December I tried to peg down Netflix’s most watched TV series throughout all of 2020. Am I just a millennial Don Quixote? No, the reason I beat my head against these particular walls is because the popularity of Netflix originals is such a malleable and nebulous concept. We, the viewing public, want to know what’s a hit and what isn’t.
So in a continued effort to bridge this impasse, let’s use Netflix’s self-reported viewership data and Nielsen’s streaming consumption metrics to define what constitutes a “hit.†This will be done using Netflix’s public self-reported ratings (big thanks to What’s on Netflix), Nielsen data provided to Observer, and Nielsen data analyzed by Entertainment Strategy Guy.
Note: Prior to 2020, Netflix counted a user that watched 70% of a movie or TV series as a view. Now, viewership is determined by whether or not a user watched at least two minutes of a title.

Chris Hemsworth in Extraction Jasin Boland/Netflix
Top 10 Most-Watched Netflix Original Movies
As of July, here are Netflix’s 10 most-watched English language original movies in their first month of availability, according to the streamer’s own viewership data:
- Extraction – 99 million views
- Bird Box – 89 million views
- Spenser Confidential – 85 million views
- 6 Underground – 83 million views
- Murder Mystery – 83 million views
- The Old Guard – 78 million views
- Enola Holmes – 76 million views
- Project Power – 75 million views
- Army of the Dead – 75 million views
- Fatherhood – 74 million views
Recently, Netflix’s global film chief Scott Stuber revealed that his team wants big budget films to draw an audience of “more than 70 million viewers,†giving us a floor for tentpole audience performance with Netflix’s data. (But not all highly-watched Netflix blockbusters are created equally, as Stuber also conceded that Ryan Reynolds’ 6 Underground will not be getting a sequel despite 83 million views)
According to Nielsen data analyzed by Entertainment Strategy Guy, the average streaming exclusive film loses 63% viewership per day from week one to week two. Netflix’s self-reported viewership data measures consumption within the first four weeks of availability. But due to this decay rate and the lack of long-term footprint Netflix original films have been found to have, we’re looking at film performance in the first two weeks of release. (Note: Nielsen only began tracking U.S. streaming viewership in April 2020).
In terms of hours watched, per Nielsen data, we can further study a handful of the above films:
Extraction (31.6 million hours watched within its first two weeks of availability)
Fatherhood (29.3 million hours)
Enola Holms (29 million hours)
The Old Guard (28.8 million hours)
Army of the Dead (28.3 million hours)
Project Power (27.8 million hours)
For additional context, The Christmas Chronicles 2 garnered 61 million Netflix views within its first four weeks of availability, failing to make Netflix’s self-reported top 10, yet generated a whopping 36 million hours within its first two weeks. George Clooney’s The Midnight Sky received 72 million Netflix views and 26.7 million hours watched in the same time frame. Netflix did not release a “datecdotes†(a phrase coined by ESG) for Adam Sandler’s Hubie Halloween, but the film did draw 26.3 million hours watched in its first two weeks. All are among Netflix’s most-popular original films.
Now Nielsen’s data is far from perfect. The service measures weekly viewership and films like The Christmas Chronicles 2, The Midnight Sky, Enola Holmes and Hubie Halloween were all released on Wednesdays while the others debuted on Fridays. Running time also plays a role in hours-watched.
But the trend is clear: Netflix original films that open to at least 25 million hours watched in their first two weeks of availability are generally considered to be “hits.†Surpassing 30 million hours in two weeks is a concrete victory. (Opening to 20 million-plus hours in Week 1 is a runaway success as only The Christmas Chronicles 2 managed to accomplish this among these Netflix features). We can add this data benchmark to Netflix’s goal of at least 70 million views for bigger budget titles to help determine wins and losses moving forward.

Regé-Jean Page in Bridgerton LIAM DANIEL/NETFLIX
Top 10 Most-Watched Netflix Original TV Series
As of July, here are Netflix’s 10 most-watched English language original TV series in their first month of availability, according to the streamer’s own viewership data:
- Bridgerton S1 – 82 million views
- The Witcher S1 – 76 million views
- Stranger Things S3 – 64 million views
- Tiger King: Murder, Mayhem and Madness – 64 million views
- The Queen’s Gambit – 62 million views
- Sweet Tooth – 60 million views
- Emily in Paris – 58 million views
- Fate: The Winx Saga – 57 million views
- Shadow and Bone – 55 million views
- You S2 – 54 million views
Based on the above list, we can safely assume that any Netflix original series that earns in the vicinity of 50 million views in its first month is a commercial win. (Apologies to non-English original hits such as Lupin, Money Heist, and Elite).
For English-language TV series, we’re looking at Nielsen data for the first four weeks to better align with Netflix’s own measurement span. But hours watched is also impacted by episode lengths and the volume of episodes available. Longer-running series such as The Crown (four seasons) have a distinct advantage. In addition, COVID-enforced lockdowns of 2020 likely inflated viewership for certain series. We’re also hamstrung a bit by Nielsen’s evolving tiered lists. The company offered only a single Top 10 list among all streaming for months before introducing Top SVOD All, Top Original Series, Top Movies, and Top Licensed.
With those caveats in mind, here’s how we can build on applicable titles from the above list in terms of hours-watched:
Tiger King (141 million hours-watched in its first four weeks of availability)
Bridgeton S1 (115.1 million hours)
The Queen’s Gambit (87.2 million hours)
Sweet Tooth (47.2 million hours)
Shadow and Bone (45.9 million hours)
Both Sweet Tooth and Shadow and Bone are getting second seasons. Bridgerton has been renewed for two additional seasons and Tiger King is also getting a follow up.
Emily in Paris debuted on October 2, when Nielsen was still offering a single Top 10 list. It didn’t pop up on Nielsen’s weekly rankings until the Oct. 5-Oct. 11 list. In that span, it garnered 11.2 million hours in the available time frame. Other comparable “Week 1†debuts include Sweet Tooth (13.2 million), The Crown S4 (13.5 million) and The Queen’s Gambit (9.2 million). Netflix renewed Emily in Paris for a second season in November. Fate: The Winx Saga, which debuted January 22, earned 30.6 million hours in its first three weeks of availability before falling out of Nielsen’s Top 10 lists. It has since been renewed for a second season.
Other 2021 Netflix originals that have also been renewed include Firefly Lane, which garnered 49 million Netflix views and 62.4 million hours watched in its first month, and Ginny & Georgia, which earned 52 million Netflix views and 56.1 million hours in its first month. Now, let’s compare these numbers to two high-profile 2021 series that were notably cancelled:
Jupiter’s Legacy (38.7 million hours in its first four weeks of availability)
The Irregulars (22.2 million hours in its first three weeks of availability before falling out of Nielsen’s Top 10 lists).
Let’s throw in some added context that includes some of Netflix’s best performers in terms of total viewership.
The Crown S4 (29 million Netflix views, but 130.7 million hours watched)
The Umbrella Academy S2 (43 million Netflix views, 141.2 million hours watched)
Cobra Kai S3 (45 million Netflix views, 107.4 million hours watched)
Virgin River S2 (No Netflix data, 78.7 million hours watched)
Outer Banks S1 (No Netflix data, but 72.1 million hours watched)
Reminder: Nielsen only covers U.S. viewership and it benefits series with longer-running episodes and more total episodes. Netflix’s selective self-reported data doesn’t always correlate with Nielsen’s for those reasons and more.
But looking at the Nielsen data, it appears as if shows that earn at least 70 million hours watched in their first four weeks of availability are “hits.†Anything working in that 80 million range are mega hits and anything that surpasses 100 million hours watched are supernovas. For first-season shows that don’t benefit from a library of pre-existing episodes in the bank, it appears as if garnering around 50 million hours in their first month of availability should secure a Season 2 renewal more often than not.
There are other comprehensive ways of breaking down Nielsen data (Entertainment Strategy Guy examines it across total viewership, total viewership per episode, and total viewership per adjusted hour). But this at least provides a base understanding of Netflix original wins and losses.
Movie Math is an armchair analysis of Hollywood’s strategies for big new releases.
